Are You Having Trouble Producing Timely Financial Reports in Oracle EBS and SAP?
You Don’t Have Full Visibility into Your Data
Most ERP solutions were built to collect data, not to report on them. Accessing data from multiple sources and formatting it in a consumable way is not an easy task.
Repetitive Manual Tasks Waste Valuable Time
Manually exporting, formatting, and consolidating data is not only an inefficient use of your finance team’s time, but it also poses a risk to data integrity.
Your Current Reporting Tools Require Technical Skills
Instead of building reports, interpreting data, and making decisions, you’re constantly waiting on IT to help you get the data and reports you need.
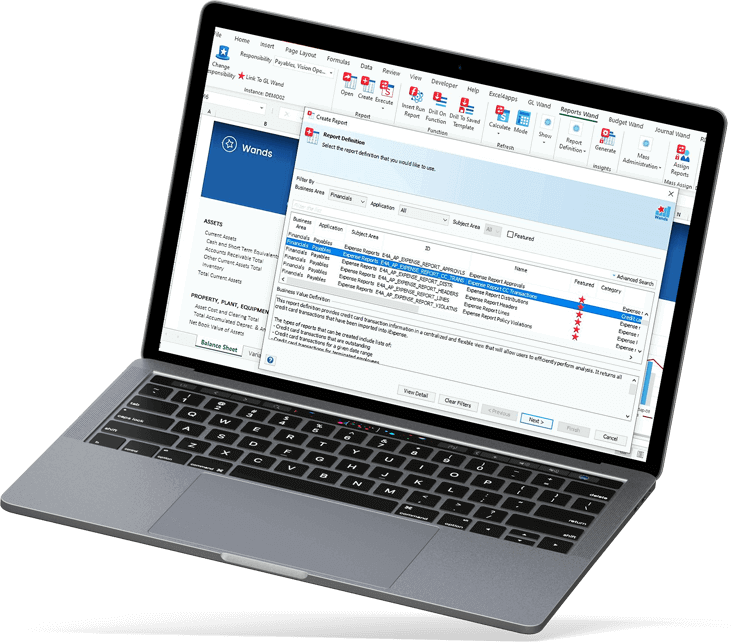
Build and Customize Ad Hoc Reports Without IT
With an easy-to-use Excel interface, Reports Wand provides the tools you need to build highly customized reports, without relying on IT. Drag-and-drop report designs allow for easy report building, and powerful drill-down configurations let you get a deeper understanding of your results.
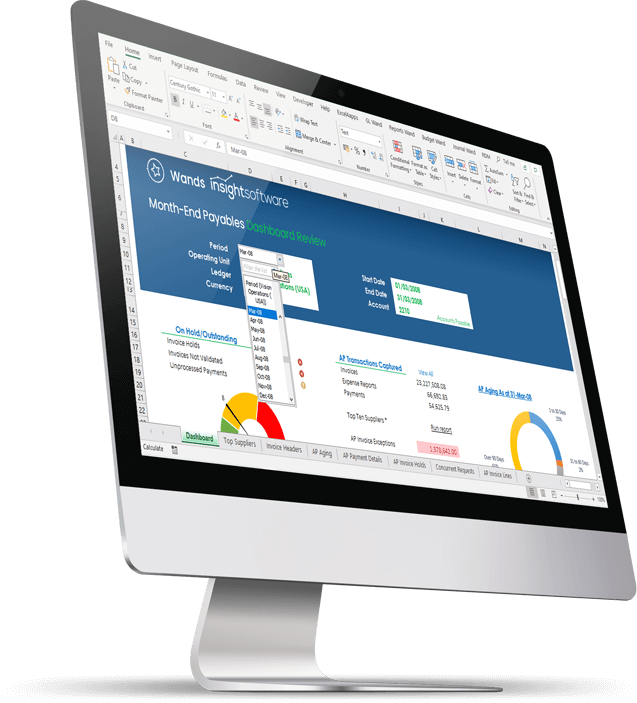
Refresh Dynamic Dashboards in Real Time
Refresh reports with live data from Oracle EBS and SAP. Dashboard reporting in Excel with Reports Wand reduces errors, improves productivity, and creates an environment that efficiently provides the right information to the right people in the correct format
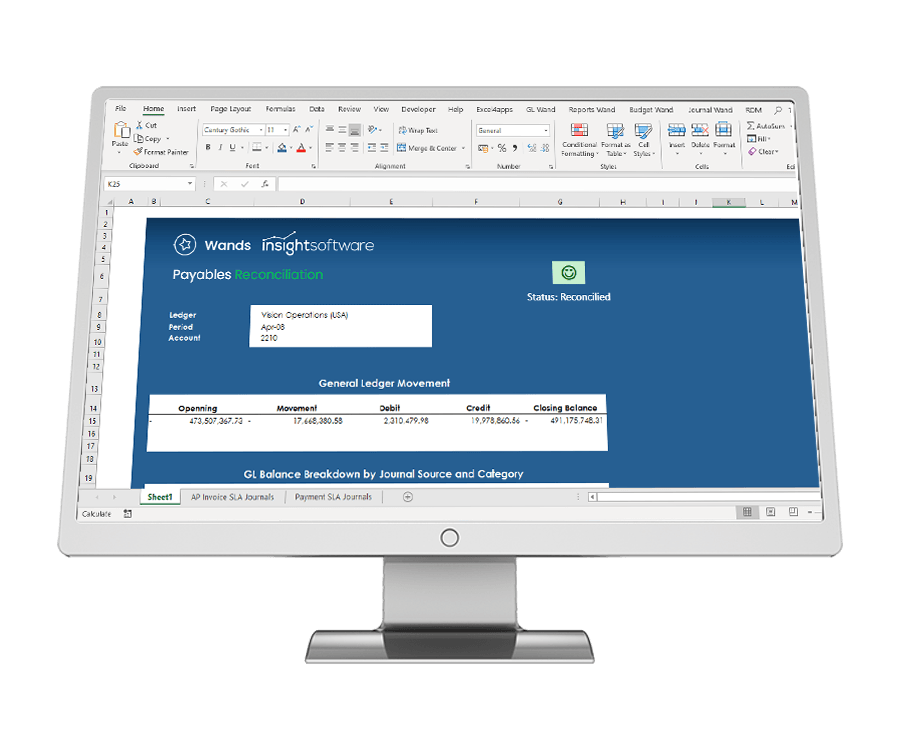
Faster Reconciliation of Data
Combine data across multiple modules in the same report. By accessing data covering the most common information requests from Finance, HR, Projects, and other modules, you get total visibility and access to all of your data for operational reporting and analysis